在混合开发中遇到了ucharts无法实现的图表
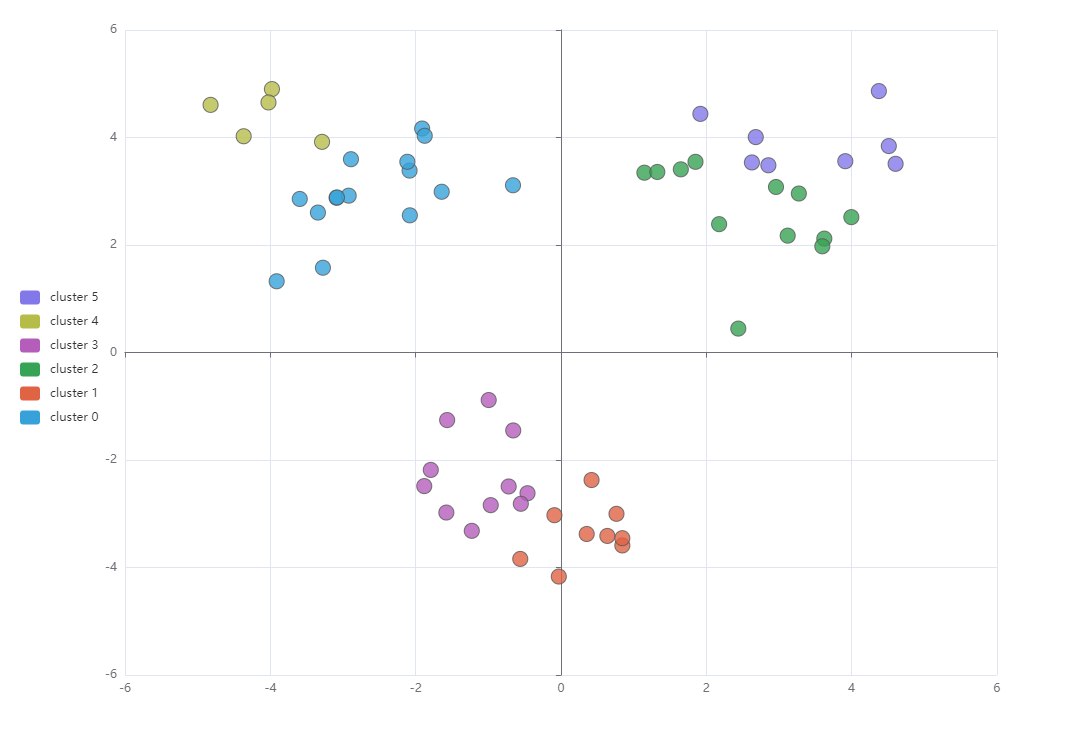
散点图
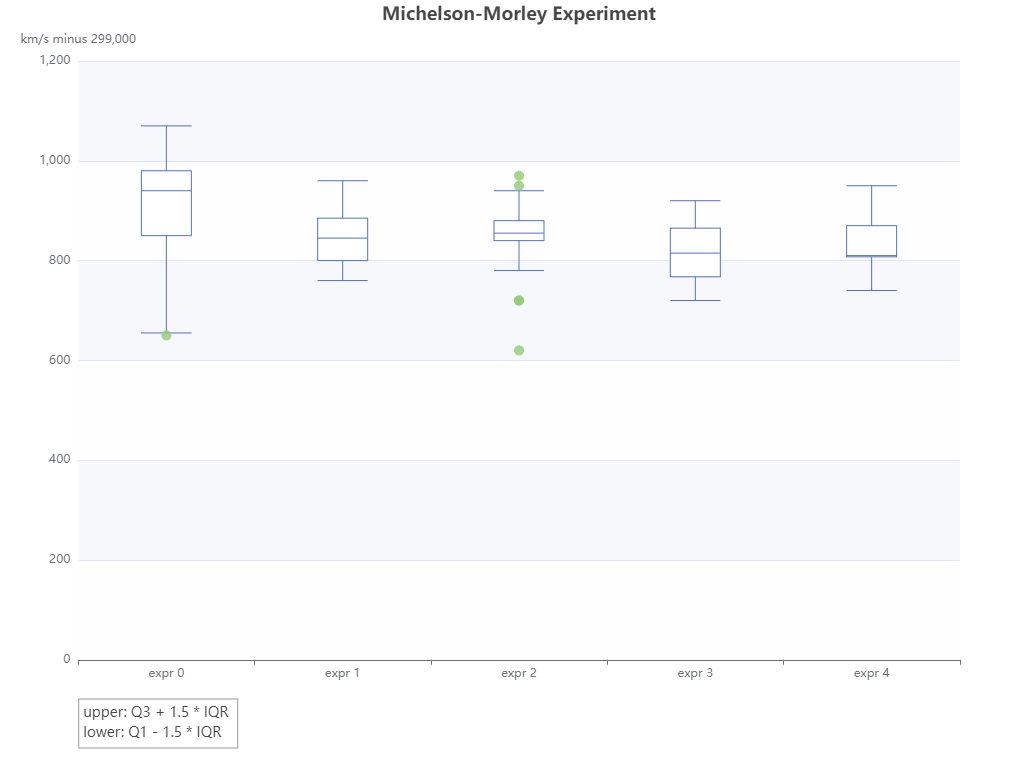
盒须图
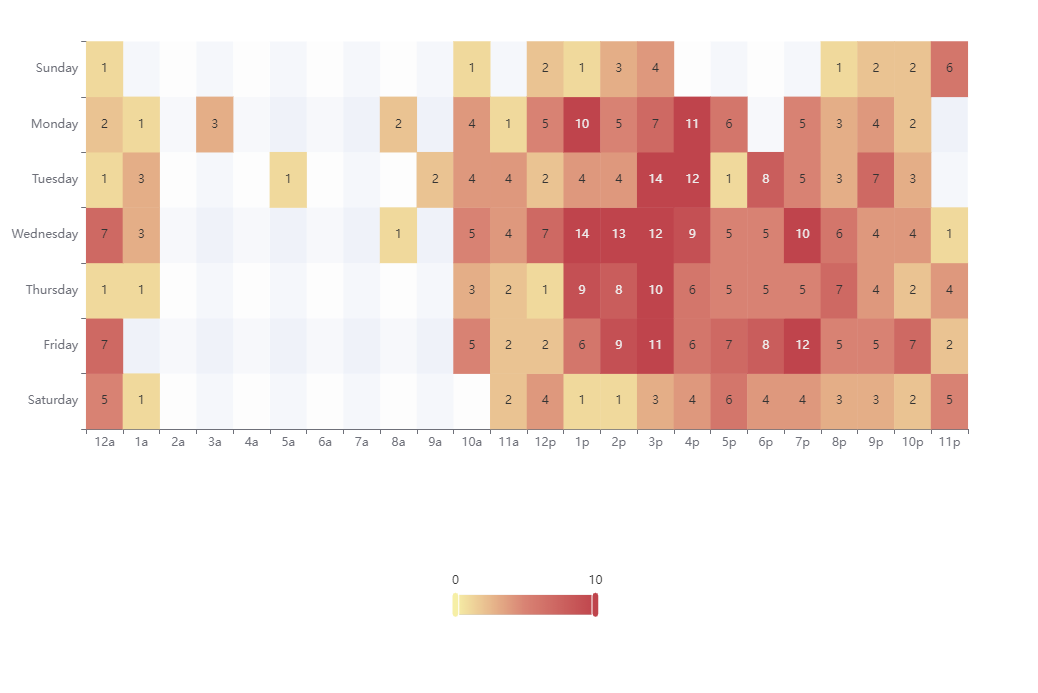
热力图
为了兼容IOS,安卓,H5 并展示图片 ,只能通过uniapp 特定的renderjs语法来实现
代码实现
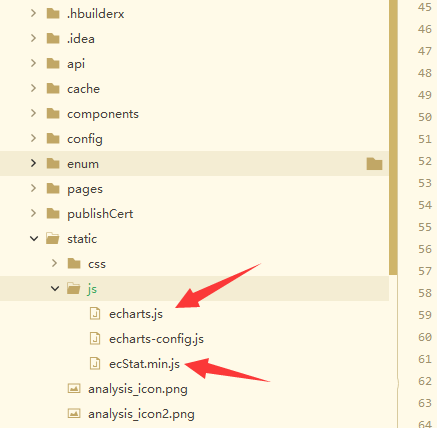
引入包
echarts.vue
<template>
	<view class="content">
		<!-- #ifdef APP-PLUS || H5 -->
		<view @click="echarts.onClick" :prop="optionData" :moduleParamProp="moduleParam"
			:change:moduleParamProp="echarts.moduleParamUp" :change:prop="echarts.updateEcharts" :id="moduleParam.id"
			class="echarts"></view>
<!--		<button @click="changeOption">更新数据</button>-->
		<!-- #endif -->
		<!-- #ifndef APP-PLUS || H5 -->
		<view>非 APP、H5 环境不支持</view>
		<!-- #endif -->
	</view>
</template>
<script>
	export default {
		data() {
			return {

			}
		},
		emits: ["getClickData"],
		props: {
			moduleParam: {
				type: Object,
				default: () => {
					id: "myCharts";
					width: "100%";
					height: "300rpx";
					type: ""
				}
			},
			optionData: {
				type: Object,
				default: () => {}
			}
		},
		onLoad() {

		},
		methods: {
			changeOption() {
				// 父组件刷新数据
				// this.$emit("changeOption")
			},
			onViewClick(options) {
				this.$emit("getClickData", options)
			}
		}
	}
</script>

<script module="echarts" lang="renderjs">


	let myChart
	export default {
		data() {
			return {
				clickData: null
			}
		},
		mounted() {
			if (typeof window.echarts === 'function') {
				this.initEcharts()
			} else {
				// 动态引入较大类库避免影响页面展示
				const script = document.createElement('script')
				// view 层的页面运行在 www 根目录,其相对路径相对于 www 计算
				script.src = 'static/js/echarts.js'
				script.onload = this.initEcharts.bind(this)
				document.head.appendChild(script)
				if(this.moduleParam.type === "scatter"){
					const ecStat = document.createElement("script")
					ecStat.src = 'static/js/ecStat.min.js'
					ecStat.onload = this.initEcharts.bind(this)
					document.head.appendChild(ecStat)
				}
			}
		},
		methods: {
			initEcharts() {
				myChart = echarts.init(document.getElementById(this.moduleParam.id))
				// 观测更新的数据在 view 层可以直接访问到
				if (this.optionData == null) {
					return;
				}
				if (this.moduleParam.type == "boxplot") {
					this.optionData.tooltip.formatter = (params) => {
						let txt = ''
						txt += params.seriesName + '<br/>' +
							params.marker + '上限值:' + params.data[5] + '' + '<br/>' +
							params.marker + '上四分位数:' + params.data[4] + '' + '<br/>' +
							params.marker + '中位数:' + params.data[3] + '' + '<br/>' +
							params.marker + '下四分位数:' + params.data[2] + '' + '<br/>' +
					  params.marker + '下限值:' + params.data[1] + '' + '<br/>'
						return txt
					}
				}else if(this.moduleParam.type === "scatter"){
					echarts.registerTransform(ecStat.transform.clustering);

				}

				myChart.setOption(this.optionData)
				// 点击传参
				myChart.on('click', params => {
					this.clickData = params
				})
			},
			updateEcharts(newValue, oldValue, ownerInstance, instance) {
				// // 监听 service 层数据变更
				// // console.log(newValue)
				 myChart = echarts.init(document.getElementById(this.moduleParam.id))
				 myChart.setOption(newValue)
			},
			moduleParamUp(newvalue, oldvalue) {},
			onClick(event, ownerInstance) {
				// console.log(this.clickData)
				ownerInstance.callMethod('onViewClick', {
					value: this.clickData.value,
					name: this.clickData.name,
					dataIndex: this.clickData.dataIndex,
					seriesName: this.clickData.seriesName
				})
			}
		}
	}
</script>

<style>
	.echarts {
		margin-top: 10px;
		width: 100%;
    height: 226px;
	}
</style>
如何使用
<template>
	<view class="content">
		<dom-echart :moduleParam="moduleParam1" :optionData="option" @getClickData="getClickData1"></dom-echart>
		<dom-echart :moduleParam="moduleParam2" :optionData="option1" @getClickData="getClickData2"></dom-echart>
		<dom-echart :moduleParam="moduleParam3" :optionData="option2" @getClickData="getClickData3"></dom-echart>
	</view>
</template>

<script>
	const dataAll = [
			{

				value: [10.0, 80],
				symbolSize: 10,
				itemStyle: {
					color: '#B797C4',
				}
			},

		];
		// prettier-ignore
		const markLineOpt = {
			animation: false,
			lineStyle: {
				type: 'solid'
			},
			data: [
				[{
						coord: [0, 50],
						symbol: 'none'
					},
					{
						coord: [20, 50],
						symbol: 'none'
					}
				],
				[{
						coord: [10, 0],
						symbol: 'none'
					},
					{
						coord: [10, 100],
						symbol: 'none'
					}
				]
			]
		};
	import domEchart from '@/components/echarts/echarts.vue'
	export default {
		components: {
			domEchart
		},
		data() {
			return {
				moduleParam1: {
					id: "moId1",
					type: "scatter"
				},
				moduleParam2: {
					id: "moId2",
				},
				moduleParam3: {
					id: "moId3",
				},
				option: {
					title: {
						text: '平均正确率:%',
						textStyle: {
							color: '#9E9E9E',
							fontSize: 10,
						}
					},
					grid: {
						left: 30,
						top: 30,
						right: 20,
						bottom: 20
					},
					tooltip: {
						formatter: 'Group {a}: ({c})'
					},
					xAxis: [{
						gridIndex: 0,
						min: 0,
						max: 20
					}],
					yAxis: [{
						gridIndex: 0,
						min: 0,
						max: 100
					}],
					series: [{
						name: 'I',
						type: 'scatter',
						data: dataAll,
						markLine: markLineOpt
					}]
				},
				option1: {
					title: {
						text: 'ECharts2'
					},
					series: [{
						name: '销量',
						type: 'pie',
						data: [53, 20, 28, 12, 10, 20]
					}]
				},
				option2: {
					title: {
						text: 'ECharts3'
					},
					xAxis: {
						data: ["衬衫1", "羊毛衫", "雪纺衫", "裤子", "高跟鞋", "袜子"]
					},
					yAxis: {},
					series: [{
						name: '销量',
						type: 'line',
						data: [53, 20, 28, 12, 10, 20]
					}]
				}
			}
		},
		onLoad() {

		},
		methods: {
			getClickData1(option) {
				console.log("点击的值", option)
			},
			getClickData2(option) {
				console.log("点击的值", option)
			},
			getClickData3(option) {
				console.log("点击的值", option)
			},


		}
	}
</script>

<style>
</style>